
Inspector
Desktop debugger for HTTP and HTTPS traffic. Decrypt HTTPS (man-in-the-middle / MITM) only on machines you control.
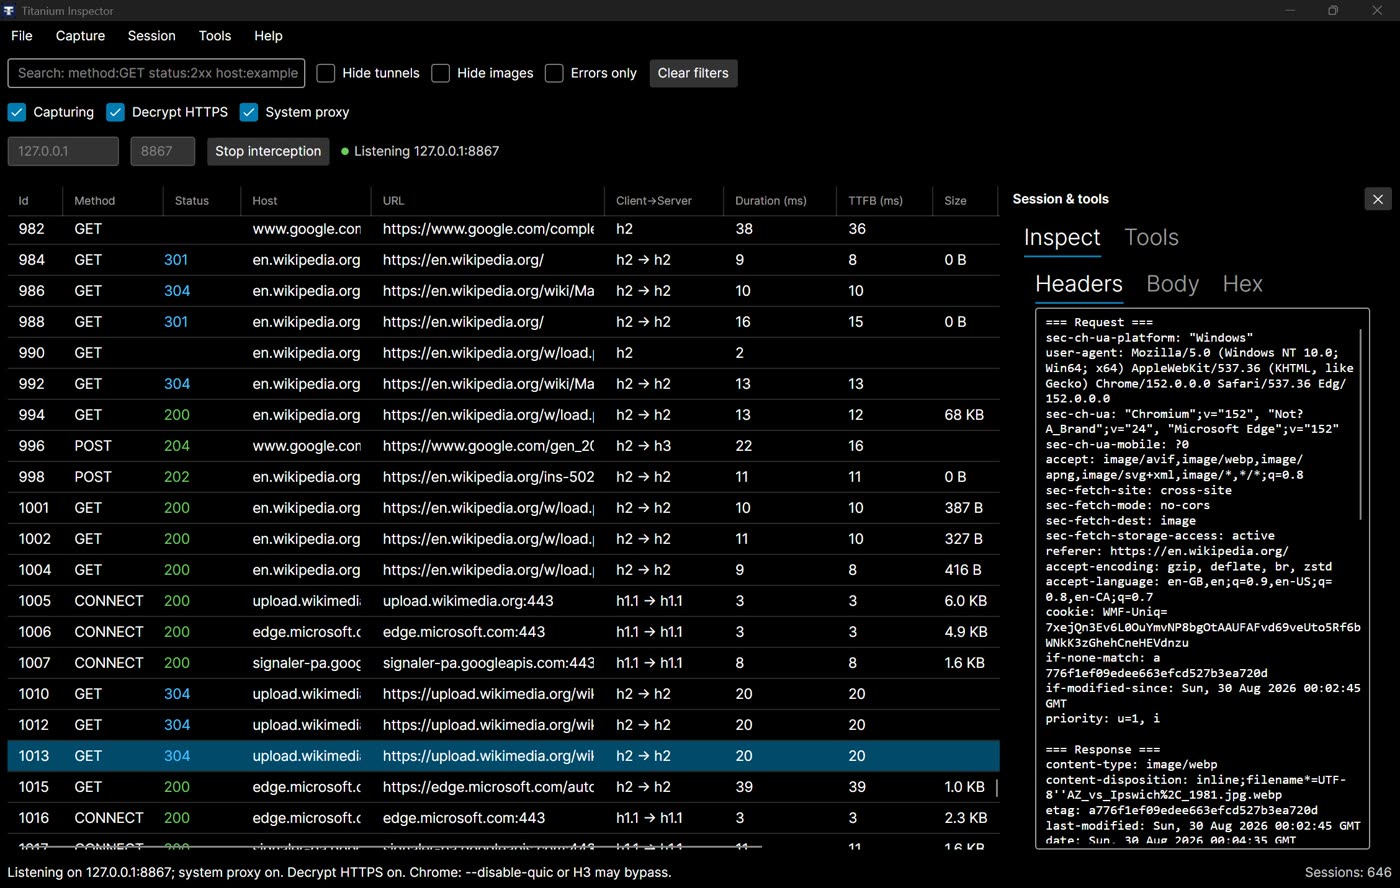
Quick use
- Download and install Inspector for your OS.
- Launch it — by default it starts listening and turns on system proxy (Capturing on). Default bind is usually
127.0.0.1:8866. - Turn on Decrypt HTTPS when you need to see inside HTTPS (installs a local root certificate if needed; you may get an OS trust prompt).
- Use the toolbar System proxy / Capturing checkboxes to pause either without quitting.
HTTPS stays encrypted (opaque tunnels) until Decrypt HTTPS is on.
Bind address
Toolbar Bind address is an IP (or alias), not a hostname except localhost. Edit it only while the proxy is stopped.
| Value | Listens on |
|---|---|
127.0.0.1 or localhost | This PC only |
0.0.0.0 or * | All IPv4 adapters, including localhost |
A NIC IP (for example 192.168.1.10) | That interface only |
:: | All IPv6 adapters |
* matches the CLI listener host alias for all IPv4 interfaces. Binding on all adapters means other machines on the network can reach the proxy — use that only on a network you trust. For a phone or other device, bind 0.0.0.0 or * and point the device at this PC's LAN IP (see Capture → Root certificate → Setup external device CA).
Bind port
Toolbar Port is a number or *. Edit it only while the proxy is stopped.
| Value | Listens on |
|---|---|
8866 (default) or any 1–65535 | That TCP port |
* or empty | An OS-chosen port (ephemeral). After Start, the box shows the port that was assigned. |
0 | Same as * |
Invalid characters (for example abc) show a short message under the box — not a conversion exception. Empty is not an error. CLI twp.yaml uses a numeric port (0 for ephemeral); Inspector * is the same idea.
Decrypt HTTPS and System proxy are toolbar checkboxes. Capture menu options (Capturing, Disable caching, Force uncompressed responses, Capture local traffic, auto-start prefs) show a check when on. Root certificate actions are under Capture → Root certificate. Disable caching and Force uncompressed responses last only for this run (off by default, not saved). They skip CONNECT, WebSocket, and range requests. Allow Store apps… (Windows) sits with System proxy. Preferences such as Session retention…, Excluded hosts…, Ignore insecure server certificates, Network and protocols…, and Logging… live under Options. Network and protocols… can chain capture through an upstream HTTP proxy (used the next time capture starts) and can turn off HTTP/2, HTTP/3 to servers, outbound TLS versions, and connection reuse. Those protocol changes apply to new connections. Turning HTTP/2 off does not turn off HTTP/3. Origin Alt-Svc: h3 headers are forwarded. Chrome, Edge, and Firefox behind Inspector as an explicit proxy kept later requests on the proxy in a local check with QUIC left enabled; Safari was not checked. On Windows, the same window can list hosts for automatic Windows authentication (NTLM, Negotiate, or Kerberos) using the account Inspector runs as. The list is empty by default. Listed hosts are reached with HTTP/1.1. Request bodies to those hosts are buffered up to 32 MB. Credentials go only to the hosts you list.
Allow Store apps… lets packaged apps connect to Inspector on localhost. Apply saves that allow list immediately. Apps that are already running keep their current connections, so when System proxy is on, Apply turns it off and back on once so they open a new connection. Fully quit and reopen an app if its traffic still does not appear. The dialog warns when the proxy is stopped or System proxy is off: the allow list only removes the localhost block, and Store apps still follow the system proxy.
Install
Prefer the Download page.
Windows
- MSI — installer wizard; uninstall from Settings → Apps.
- Portable zip — extract and run
TitaniumInspector.exe.
Current Windows installers are on the Download page. Beta builds are in the beta Inspector section.
Linux
Extract the zip, then run ./TitaniumInspector, or:
chmod +x install.sh uninstall.sh TitaniumInspector
./install.sh          # ~/.local/share/TitaniumInspector + desktop entry
macOS
Extract the zip, then run ./TitaniumInspector, or:
chmod +x install-app.sh uninstall-app.sh TitaniumInspector
./install-app.sh      # ~/Applications/Titanium Inspector.app
Updates
Help → Documentation opens the Inspector guide, and Help → Report an issue opens a new GitHub issue. Help → Keyboard shortcuts lists the keys. F12 toggles capturing. Ctrl+F focuses search (Cmd on macOS). Ctrl+Shift+Delete clears sessions. R replays the selected session, and Delete removes the selected rows, only while the session list has focus and you are not typing in a text box. Help → Update channel — Stable (default) or Beta. Help → Check for updates… offers install only when there is a real change (newer build or channel switch). Accept downloads the package, closes Inspector, replaces the install, and relaunches.
Right pane: Inspect and tools
A far-right icon rail (Inspect, Composer, Breakpoints, AutoResponder, Scripts, Map Remote) is always visible. Clicking an icon opens that tool’s content to the left of the rail and pushes the session grid; the grid scrolls horizontally when columns no longer fit. Click the same icon again (or ✕) to close the content pane; the rail stays. Tooltips show full names.
Inspect keeps Request and Response tabs inside the Inspect content (and Diff, WS Frames, SSE, or Protobuf when that session uses them). Statistics is the last tab: one session shows its measured phases, and several selected sessions show a short summary. A tunnel or a session without recorded timing shows no phase bars. An older HAR file is marked estimated and also draws no bars. When a rule, script, breakpoint, retry, certificate problem, or capture tweak changed the session, Statistics lists that event. A plain request lists none. Tools → Recent logs… opens an in-memory window of the latest proxy log lines (not a search of the log files). The default level is Error, so only failures appear until you raise it in Logging. Debug and Trace use more CPU. When Save logs to files is on, Inspector writes dated files under the log folder and starts a new file each time one reaches the maximum size, keeping the newest few. Each tab shows that side's headers above its body, with a splitter between the two panes. Collapse the headers pane from its bar, or double-click the splitter to restore the default one-third / two-thirds split. On a short window the headers pane starts collapsed so the body keeps the space; expanding it is remembered. Selecting a session while a tool is open does not switch away from that tool. Tools change how all traffic is handled and do not require a selected session.
Use Tools → Composer / Breakpoints / AutoResponder / Scripts… to open the matching icon. Opening content when it was closed from a session click lands on Inspect. Tools → Timeline… charts the newest 2,000 sessions with the same phases as Statistics. A tunnel is one plain bar, estimated timing is hatched, and a request still in progress extends to the last refresh. Selected sessions are highlighted on the chart. Click a bar to select that session; selecting in the grid highlights it in the Timeline. Closing the window stops the refresh.
Inspect (this session)
- Request — request headers (including cookies and query) above the request body. gRPC-JSON transcoded sessions also show the client versus upstream summary in the headers. Copy headers copies the headers. Pretty is a checkbox (on by default) that indents JSON, XML, and HTML while this tab is selected. Hex is a checkbox that switches the body to a hex dump of the first 4 KB; Pretty is disabled while Hex is on, and its previous state returns when Hex is cleared. Images show a bitmap preview that uses about 40% of the body pane. A banner explains a truncated, not-captured, or streaming request body. Save request… writes the captured bytes (incomplete when truncated).
- Response — response headers above the response body, with the same Pretty, Hex, image preview, and capture banner. Copy headers copies the response headers. Save response… writes the captured response bytes. A CONNECT tunnel's opaque-reason note appears at the top of both tabs. A session still waiting on the server shows "Waiting for response…"; one that ended without any response shows "No response received" with the reason (connection refused or reset, timeout, client disconnected, or capture stopped).
- WS Frames — shown for WebSocket sessions; live frames when available (direction, opcode, payload preview). A single frame larger than 16 MiB is relayed and listed as "payload not captured" instead of closing the connection.
- SSE — shown for
text/event-streamresponses; Inspector does not buffer SSE inBeforeResponse(events stream to the client; a 2 MiB preview may fill while open) - Protobuf — wire-format field dump for gRPC and gRPC-JSON-transcoded upstream frames (field number, wire type, value). MVP does not require a
.protoset/ descriptor set; the optional settings fieldProtobufDescriptorSetPathis stored for a future typed decode. Until then, the Protobuf tab always shows the JSON wire dump.
Body capture limits: finite bodies with known Content-Length up to 32 MiB are buffered then previewed at 2 MiB (text view capped at 256 KiB). Larger known-length bodies are not captured so downloads are not stalled. Bodies with no declared length (chunked, HTTP/2 without Content-Length, SSE) are never buffered, whatever their content type: they are relayed untouched and the first 2 MiB is previewed live (decoded for gzip/deflate/br), so large downloads/uploads of unknown size (for example a git clone) are not aborted by the buffer limit. Size column shows the original length when known.
Search for WebSocket traffic with is:ws. Search for gRPC with is:grpc, and for gRPC-JSON transcoded sessions with is:transcoded (client REST/JSON vs upstream gRPC faces appear on the request and response inspect tabs). Quick filters on the toolbar toggle hide:tunnel, hide:image, and is:error into the same search box. Status writes one status: token (checkboxes for 2xx–5xx, plus codes or ranges such as 304, 500-599). A word with no prefix matches the URL, host, process name, exact process ID, method, or exact status code. Prefixes limit the match to one field: method:, status: (exact, 2xx–5xx, a comma list, or a range), host:, url:, process:, pid:, protocol:, content-type:, and body: (including bodies spilled to disk). A leading - excludes that field (-host:cursor.sh, -process:Cursor) or, on a bare word, whatever that word would match (-cursor); right-click a row and choose Hide host or Hide process to add one. Mark paints a colored left stripe on the row (and a status-bar confirmation). Comment… adds a note of up to 2,000 characters: the Comment column turns on so you can read it in the grid, the note also appears on row hover, and the status bar confirms the save. Search with mark:red or comment:word. Both are kept in the native archive and in HAR (comment, and the mark inside _inspector). Each hidden host or process also appears as a chip under the search box (× removes that one). Advanced opens a larger window for the same search plus those hide lists; Apply writes it back and Cancel leaves the toolbar unchanged. Hiding a row does not stop decrypting it — that is Exclude host…. Clear filters removes the chips with the rest of the search. When Network and protocols differs from the defaults, the status strip shows Custom settings (N) beside the session count. Hover or click lists those changes. Reset restores only those settings. The status strip shows Sessions: N · since HH:mm with no filter (the start time of the oldest session still kept; the date is added when that is not today, e.g. since Oct 6, 14:05), and Sessions: X of Y match filter · since HH:mm when a search or quick filter is active. After the session retention limit has dropped older rows, Y is labeled most recent (round thousands as 10k, e.g. Sessions: 10k most recent · since 14:05). If a filter matches nothing, it also shows how many older sessions retention removed, since those are no longer searched. Click the count to open Session retention… and change how many sessions are kept. What Clear sessions removes, and what stays on disk, is described in Session retention and clearing.
Network throttle: use the toolbar Throttle combo (None, Slow 3G, Fast 3G, LTE) to add latency and bandwidth shaping on body writes / WebSocket frames during capture. Off by default (None); the hot path skips delay work when no profile is enabled.
Tools (all traffic)
Pipeline order on each request:
Disable caching / Force uncompressed (when checked) → Scripts → AutoResponder → Map Remote → Breakpoints → origin
Composer
Build and send a request through the proxy. Load from selected copies method/URL/headers/body from the current session. Load body from file… loads small files into the editor, or streams large files on Send without stuffing them into the text box. Responses are preview-capped (no hang on endless streams).
Breakpoints
Pause matching requests (URL glob; * = all) so you can edit the body, Continue, or Abort (403). At most one pause at a time; unmatched overflow auto-continues; pauses time out after 120 seconds. Optional Break on response. Editing a streaming (SSE) body is refused.
Match URL and optional GraphQL operation together: leave GraphQL blank to pause every operation; set it (for example GetUser) to pause only that client request. From selected session copies the operation name from the session selected in the grid.
AutoResponder
If Enabled, the first matching rule returns a fake status/body before the real server (and before breakpoints). Match URLs with * wildcards. Inline body Add/Update is capped at 256 KiB — use Map Local for larger stubs.
Map Local: set an optional file path on the rule (or use Browse…). When the path is set, the response body is streamed from that file (with Content-Length) instead of the inline body field. Inline body is used when Map Local is empty. Missing or oversized files cause the rule to be skipped (request continues to breakpoints/origin).
Match (URL + optional GraphQL) decides which client requests a rule applies to. Respond with is the fake status/body. Status is 100–599; empty means 200. Invalid characters show a short message under the box (not a conversion exception). Same /graphql URL can have one rule per operation.
Map Remote
If Enabled, the first matching rule rewrites the request URL to another absolute origin before breakpoints and the real server. Match with * wildcards. A single * in both match and target preserves the captured path/query suffix (for example match https://prod.example/* → target http://127.0.0.1:5000/*). Map Remote does not run when AutoResponder / Map Local already answered the request. Optional GraphQL operation on Match rewrites only that operation.
GraphQL matching reads the client JSON operationName (or a named query/mutation). It does not force buffering of huge request bodies (that would reset HTTP/2).
Scripts
One command per line (not JavaScript or C#). Comments start with # or //. Applies to every captured request/response.
| Command | Meaning |
|---|---|
set-header Name: Value | Add or replace a header. Traffic still continues. |
set-status 404 | On request: answer immediately and skip AutoResponder, breakpoints, and the origin. On response: rewrite the status the client sees. |
abort | Block with 403. Combine with set-status to pick a different code. |
set-header X-Debug: 1
set-status 404
abort
Advanced
Session retention and clearing
Options → Session retention… sets how many sessions stay in the list and how much disk the saved HAR files may use. Each Inspector run writes into a timestamped folder under the session cache (local application data, TitaniumInspector/session-cache). The folder is created on the first captured session, so a run that captures nothing does not leave an empty folder.
The list limit and the disk limit are separate:
| Action | List | Current run on disk | Earlier runs on disk |
|---|---|---|---|
| List is over Maximum sessions to keep | Oldest rows leave the list | Those rows stay as HAR files | Unchanged |
| Over Disk space for saved sessions | Rows stay; missing bodies show a hint | Oldest HAR files go first, across every run | Same. An emptied run folder is deleted |
| Capture → Clear sessions | Cleared | Deleted, including rows the list limit already hid | Kept, so you can import them from the cache folder |
| Clear saved session cache… | Kept | Deleted after you confirm the run count and size | Deleted |
Keep only selected sessions… and Remove sessions matching filters… ask first. Remove-matching needs an active search or filter (an empty search would match every row). The question says how many sessions will go and how many of those are hidden by the current filter. The rows are chosen when you confirm, so a filter change while the question is open does not change the set. Clear sessions does not ask for confirmation. The status line reports how much disk it freed. Clear saved session cache… is on the Session retention window, next to Open cache folder, and asks before it deletes. Sessions stay in the list, but their saved bodies are removed. New captures use a fresh run folder.
Excluded hosts
Options → Excluded hosts… edits OS bypass, tunnel-only, and auto-tunnel learning. Capture → Capture local traffic controls whether loopback uses the system proxy (not a host list).
| Layer | Effect |
|---|---|
| OS bypass | Traffic never reaches Inspector (when System proxy is on) |
| Not decrypted hosts | Session stays visible but HTTPS stays opaque |
| Automatically not decrypt on decrypt failure | Session-only list of hosts learned after origin TLS fails under decrypt, or after the origin server returns 403/429. Document navigations auto-retry via meta-refresh onto an opaque CONNECT. On by default. Cap + TTL; cleared on restart unless you Promote to not decrypted hosts. |
Factory seeds keep common identity / SSO hosts on OS bypass so sign-in keeps working. Right-click a session → Exclude host… to stop reading that host's HTTPS (it still appears in the list). Opaque sessions show why they stayed encrypted (including auto-tunneled after decrypt failure). Search: is:opaque, opaque-reason:learned. Chrome QUIC may bypass the proxy entirely — not fixable via host lists.
Hostile hosts that return 403/429 under MITM on a document navigation are recovered automatically (brief meta-refresh; no manual reload). Non-document 403/429 need repeated strikes before later CONNECTs tunnel. Automation browsers may still see site captchas after tunneling.
Root certificate (Decrypt HTTPS)
Install root CA (current user) trusts the decrypt certificate on this PC (OS may show a Yes/No trust dialog). Use Export root CA… / Setup external device CA for phones or other devices. Remove root CA / Clear and reinstall… / Trust CA in Firefox… are under Capture → Root certificate when you need cleanup or Firefox-specific trust. Prefer those menu actions over editing certificate stores by hand.
Platform matrix (system proxy and root CA)
| Feature | Windows | macOS | Linux |
|---|---|---|---|
| System proxy | WinINET (automatic) | networksetup (disables PAC/WPAD/SOCKS so CFNetwork/Firefox see HTTP(S); admin prompt if required) | GNOME gsettings + KDE + process http(s)_proxy + Chromium/Edge launch hooks + Firefox profile prefs |
| Instant browser switch | OS settings (live for most apps) | OS settings (live for most apps; Firefox may need restart) | Chromium/Edge quit+relaunch with --proxy-server; Firefox prefs + quit/relaunch |
| Root CA user trust | Current-user Root store | Login keychain (security) + .NET store | .NET store + user NSS (certutil, Chrome/Edge/Chromium incl. Snap/Flatpak DBs) |
| Root CA machine / admin | UAC + certutil | System keychain (macOS auth dialog) | pkexec + update-ca-certificates |
Missing certutil | N/A for OS trust | Trust CA in Firefox… can run brew install nss when Homebrew is present | Recovery dialog can install libnss3-tools / nss-tools / mozilla-nss-tools via pkexec |
| Firefox | Trust CA in Firefox… sets ImportEnterpriseRoots (restart Firefox) | Install root CA writes profile user.js (security.enterprise_roots.enabled); NSS certutil is the fallback. Never modifies Firefox.app. | Profile user.js OS-root trust first; NSS import fallback; system proxy also writes network.proxy.* in the default profile |
| Cancel elevation / recovery | Leaves settings unchanged | Leaves settings unchanged | Leaves settings unchanged |
Notes:
- Headless Linux without polkit/GUI cannot show an admin dialog; use Export CA and install manually.
- Trust CA in Firefox… remains available for NSS profile import. Install root CA also best-effort writes
security.enterprise_roots.enabledin the default profileuser.js(macOS includesFirefoxDeveloperEditionandFirefox Nightlyprofile roots; Linux includes Snap and Flatpak). Inspector does not write intoFirefox.app. If Firefox is running, Inspector can ask it to quit gracefully (with consent) before writingcert9.db; on macOS it falls back to SIGTERM if osascript is blocked. - On Linux, System proxy also updates Chromium-family managed policy / Preferences /
.desktophelpers and Firefoxprefs.js, then relaunches already-open Chrome, Edge, Chromium, Brave, and Firefox so traffic switches without a manual restart. On exit or proxy off, settings are restored and browsers are relaunched without the Inspector endpoint (with a short fail-open tunnel if Chromium still pointed at a dead port). - On Windows, the first Current User Root install may show an OS Trusted Root Yes/No dialog (not UAC); choose Yes. Inspector cannot replace that dialog.
- macOS without Homebrew: OS-root trust via
user.jsdoes not needcertutil. Export CA and import under Firefox → Authorities only if enterprise-roots is not enough. - Enabling System proxy on macOS turns off PAC, WPAD, and SOCKS so Firefox (CFNetwork) sees the HTTP(S) proxy; previous PAC/SOCKS settings are restored when System proxy is turned off. Firefox that was already open may need a restart.
- KDE proxy reload is best-effort; a session restart may be needed if apps do not pick up changes.
- If user-level CA install fails, Inspector offers an adaptive recovery dialog (tools / Keychain / admin).
- Contributors: unit/integration tests never open OS cert UI (
TITANIUM_SKIP_ROOT_STORE_UI=1). For live System proxy / Install CA / browsers / Store apps UX, runtools/InspectorDesktopProbe(dotnet run --project tools/InspectorDesktopProbe -- all). Results:tools/InspectorDesktopProbe/results/last-run.json.
Other features
- Session grid columns: by default Id, method, status, host, URL, Protocol, duration, Wait (TTFB), size and process. Right-click a column header (or use Options > Columns) to show or hide columns, including the optional Started (local time, hover for the full date), Scheme (
http,https,ws,wss; empty for CONNECT tunnels) and Content-Type (media type without parameters; hover for the raw value) columns, which are hidden until you add them. Host and URL always stay visible (together they say where each request went), and Process appears only where the OS can supply it. Your choice is saved immediately and kept with the column widths and order; Reset columns restores the defaults. If you hide the column the grid is sorted by, the sort returns to Id ascending. The URL column shows the path and query because Host already shows the host (a non-default port stays as a prefix such as:3000/api, and a CONNECT tunnel has no path, so its URL cell is empty); hover a row for the full URL orhost:port. Ctrl+C, Copy URL, and search still use the full URL. Row right-click menu: Replay, Load into Composer, Export selected HAR/archive, Copy URL, Copy as curl, Copy as fetch, Diff selected (exactly two sessions), Filter by host, Hide host, Exclude host, Filter by process, Hide process. - Session context menu: right-click groups actions under Save, Export, Copy, Filter, Mark, and Find related. Multi-select keeps only actions that apply to the whole selection (for example Copy → URL and Mark); single-only items such as Replay, Save, and curl / fetch stay hidden. Filter appears when the selection shares one host, status, or process. Copy → curl / fetch / PowerShell / Python need one non-tunnel session; Rows as table copies the selection (tab-separated, at most 50,000 rows; cells that start with
=,+,-, or@are prefixed so a spreadsheet does not treat them as formulas). Save → Raw HTTP text writes the request and response. Bodies already spilled to disk are read from that file, and a body longer than 32 MB is cut with a note on the status line. - Always on top (Options) keeps the main window above other windows and is saved with the rest of the settings. Reset settings turns it off again. Some Wayland desktops ignore the request; the choice is still saved.
- Find related: right-click one row and choose the same URL, the same client connection, the same Referer, or the redirect chain. The chain follows
Locationfor up to 20 hops and only looks at the newest 5,000 sessions. The search box gets oneids:token (at most 500 ids) for that moment, shown as a chip. Clear filters removes it. A connection id stays in memory for the live capture and is dropped on import, because those counters start again at 1 each time Inspector starts. - Session Diff: with exactly two sessions selected, compare method/URL/status/headers/bodies offline. The result opens on the Inspect Diff tab and is copied to the clipboard.
- HAR / archive: Export all writes every captured session; Export selected writes the grid multi-selection. Import appends sessions from the file. Replay selected session. Exported HAR timings use the measured phases (DNS, connect, TLS, send, wait, receive). TLS time is included in connect. A reused or prefetched connection does not repeat that setup time. Older files keep their duration and wait, and are marked estimated.
- System proxy (toolbar), Capture local traffic, and root CA install / untrust / export under Capture → Root certificate; Setup external device CA dialog for external devices; Allow Store apps… on Windows
- Search plus a grouped Filters strip (bare words match URL, host, process name, exact process ID, method, and status; prefixes such as
method:GET status:2xx host:example process:chrome pid:42 protocol:h2 is:ws hide:tunnel; a leading-excludes a field, as in-host:cursor.shor-process:Cursor, also added by the row menu Hide host / Hide process, and shown as removable chips; Advanced… edits that search and those hide lists in a larger window); strip controls: Status, Hide HTTPS tunnels, Hide images, Errors only, and Clear filters (enabled only when a filter is active) - Optional Plus panels when
Titanium.Plus.dllis present